I recently decided to learn how to do more things than just simulate macroeconomic models in Octave (an open source version of Matlab) using Dynare (DSGE simulation tool for Matlab and Octave). The result was a whole lot of fun graphs:


First, I made the graph for a small labor market:

Next, I figured out how to make a Cobb Douglas Production Function:

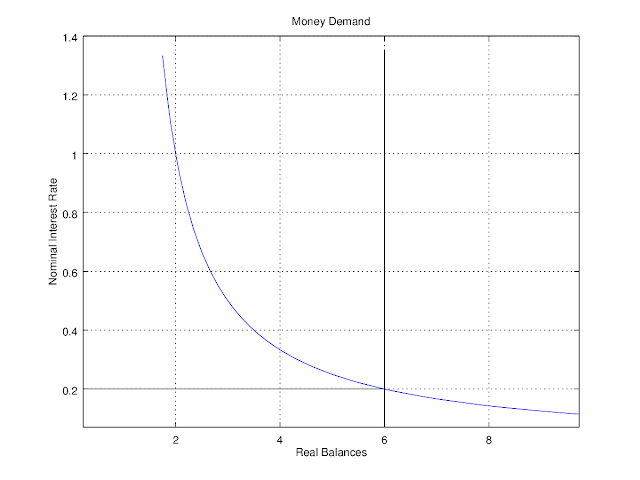
Next, I made a drastically simplified money market:

Then I made a simple linear Utility Function with two consumption goods:

And finally, I made a graph showing utility maximization with a budget constraint (still working on this one):

No comments:
Post a Comment